How these times are worked out
Every high water on this site is produced the same way: an astronomical prediction for one standard port, shifted by a fixed number of minutes for your location, and published as a window rather than a single minute. None of it is secret — and where we are least confident, we say so on the page it affects.
What “sunrise” and “sunset” mean on this site
Sunrise and sunset are true sunrise and sunset — the moment the sun’s upper edge meets the horizon, including the bend the atmosphere puts in the light. That is the same definition an almanac uses. There is usable light before and after: civil twilight begins about 40 minutes before sunrise here in summer, and ends about 40 minutes after sunset.
The calculation, in three steps
This is the long-established way smaller places are published in tide tables everywhere: a named standard port, plus a time difference for the place you actually want. The technique is common property — what varies between publishers is the quality of the two numbers. We publish ours because they are the part most likely to be wrong.
-
Step one
Predict high water at Immingham
We compute the astronomical tide from published harmonic constants — the set of astronomical frequencies whose sum describes the tide at a particular place. That gives a high water time at the standard port, to the minute.
-
Step two
Add a fixed offset for your location
High water reaches this coast later than it reaches the standard port, and later still at the head of a creek than at its bar. Each location carries one number in minutes. That single number is where almost all of our uncertainty lives.
-
Step three
Publish it as a window
We widen the result into a range — ±30 or ±40 minutes depending on the location — and show that. A single printed minute would imply a precision the method does not have.
Where the maths comes from
The harmonic constants come from the TICON-4 dataset (Hart-Davis et al., 2025), published under a Creative Commons CC BY 4.0 licence, and reach us through the open-source @neaps tide library. We compute the astronomical tide from those constants ourselves and apply the offset above.
The licence matters as much as the accuracy. The most authoritative UK tide predictions are Crown copyright and are not licensable for a site like this one, so we neither use nor republish them. Everything here is derived from openly licensed data we are entitled to build on, and the method itself — a standard port plus a difference — belongs to nobody.
Why Immingham?
It is a Class A standard port with a long, well-determined record, and it is the port this coast is conventionally referred to. We tested Cromer as an alternative reference — closer, and a more similar coastline — and it performed measurably worse, leaving a residual scatter of about 10 minutes against Immingham’s 6. So Immingham stayed.
Every location, and how much we know
These are the numbers actually used to build the tables you are reading, generated 23 October 2026.
| Location | Minutes after Immingham | Window | Confidence |
|---|---|---|---|
| Hunstanton | +10 | ±40 | Worked out from nearby coast |
| Holkham Beach | +17 | ±40 | Worked out from nearby coast |
| Wells-next-the-Sea | +33 | ±30 | Checked against a tide gauge |
| Brancaster Staithe | +37 | ±30 | Worked out from nearby coast |
| Burnham Overy Staithe | +47 | ±30 | Worked out from nearby coast |
| Morston | +62 | ±30 | Worked out from nearby coast |
| Blakeney | +67 | ±30 | Worked out from nearby coast |
Every offset is minutes after high water at Immingham. The full sentence explaining each location’s status sits on that location’s own page.
What the three confidence labels mean
There is no fourth label reading “verified”, and there never will be while the evidence looks like this.
- Checked against a tide gauge
- There is a tide gauge here, and we have compared our predictions against what it recorded. This is the only class of location where we can tell you the timing has been checked against real water.
- Worked out from nearby coast
- No tidal station of any kind exists here. The offset is reasoned from the coast either side — from how high water propagates along this shore, and from how far up a creek the location sits. It is argued, not measured.
- Not independently checked
- The offset has never been checked against a continuous record of what the water did. It is a plausible figure carried forward. Burnham Overy Staithe is the near-exception: we have taken one field observation there and it landed four minutes from our published time — but a single reading on a single tide establishes a direction, not a number, so the label stays until there is a run of them.
A prediction is not an observation
This is the most useful thing we have learned, and it cost us a comfortable assumption.
When compared against the other tide prediction products that are freely available, we found close agreement — at several locations to within a minute. That felt like validation. It was not. Those products are harmonic predictions of the astronomical tide just as ours is, and most of them trace back to the same small number of underlying sources, so agreement between them tells you only that the models agree. It says nothing about what the water actually did.
The Environment Agency runs real tide gauges and publishes the readings under the Open Government Licence. There is one at Wells. The first time we compared our predictions against measurement rather than against another model — 39 high waters over 21 days — we were running an average of 19.5 minutes late, and every single one of the 39 was late. All-positive is the signature of a systematic error, not weather; wind and surge scatter both ways.
Late is the unsafe direction. It means the water peaked earlier than we said, so someone timing an arrival by our table would have met a falling tide.
What we changed because of it
In July 2026 we recalibrated Wells against the gauge, moving its offset from +55 to +36 minutes. We also widened every window, having found that under the old ±20 minutes, 18 of those 39 measured events fell outside the published window. Under ±30, two did.
The limits of that change belong next to it:
- It is 21 summer days. There is no seasonal coverage. A winter sample, on a coast that sees a lot of northerly wind, could move the number again.
- It is one gauge. Everything rests on a single Environment Agency instrument a few hundred metres from the quay, never checked against a second one.
- It changes what Wells means. Wells now targets the observed peak of the water. Our other locations target the astronomical high water. On this coast those are not the same instant, and that is a real split across one product.
- If it is wrong, it is wrong safely. Moving times earlier restores margin rather than removing it.
Wells is therefore better calibrated than the rest, not proven right. Our other locations have no gauge, have not been calibrated this way, and are likely to run a little late for the same reason.
Why one offset can never be exactly right
The standard port has a near-symmetrical tide: it takes about as long to rise as it does to fall. This coast does not. In the shallow creeks and across The Wash the flood is fast and the ebb is long and slow — at Wells the two differ by around half an hour.
Shifting a symmetrical curve sideways by a fixed number of minutes cannot reproduce an asymmetrical one. The measurements show it plainly: at Wells we predicted high water late and low water early, by roughly equal and opposite amounts, while the symmetrical control sat within a couple of minutes on both. Correcting high water with a single offset therefore makes low water worse.
- This coast — flood-dominant (Hunstanton, 5h52 rise, 6h37 ebb)
- The standard port — near-symmetric (6h17 rise, 6h12 ebb)
The proper fix is a separate high-water and low-water difference per location, which is what the fuller tide tables publish and what we dropped when we simplified to one number. Until we can source or measure those pairs, the honest response is the window — and telling you it is there.
It is also why this site publishes the high water instant and nothing derived from the shape of the curve between tides. A “hours until high water” dial or a state-of-tide bar built on a shifted symmetrical curve would be wrong by up to three quarters of an hour at some of these locations, and wrong in a way that looks authoritative.
Locations with no gauge
Only Wells has a tide gauge. There is no gauge at Burnham Overy Staithe, Brancaster Staithe, Blakeney, Morston, Holkham or Hunstanton, and for three of those there is no tidal station of any kind published by anybody. Any offset quoted anywhere for them — ours included — is somebody’s interpolation.
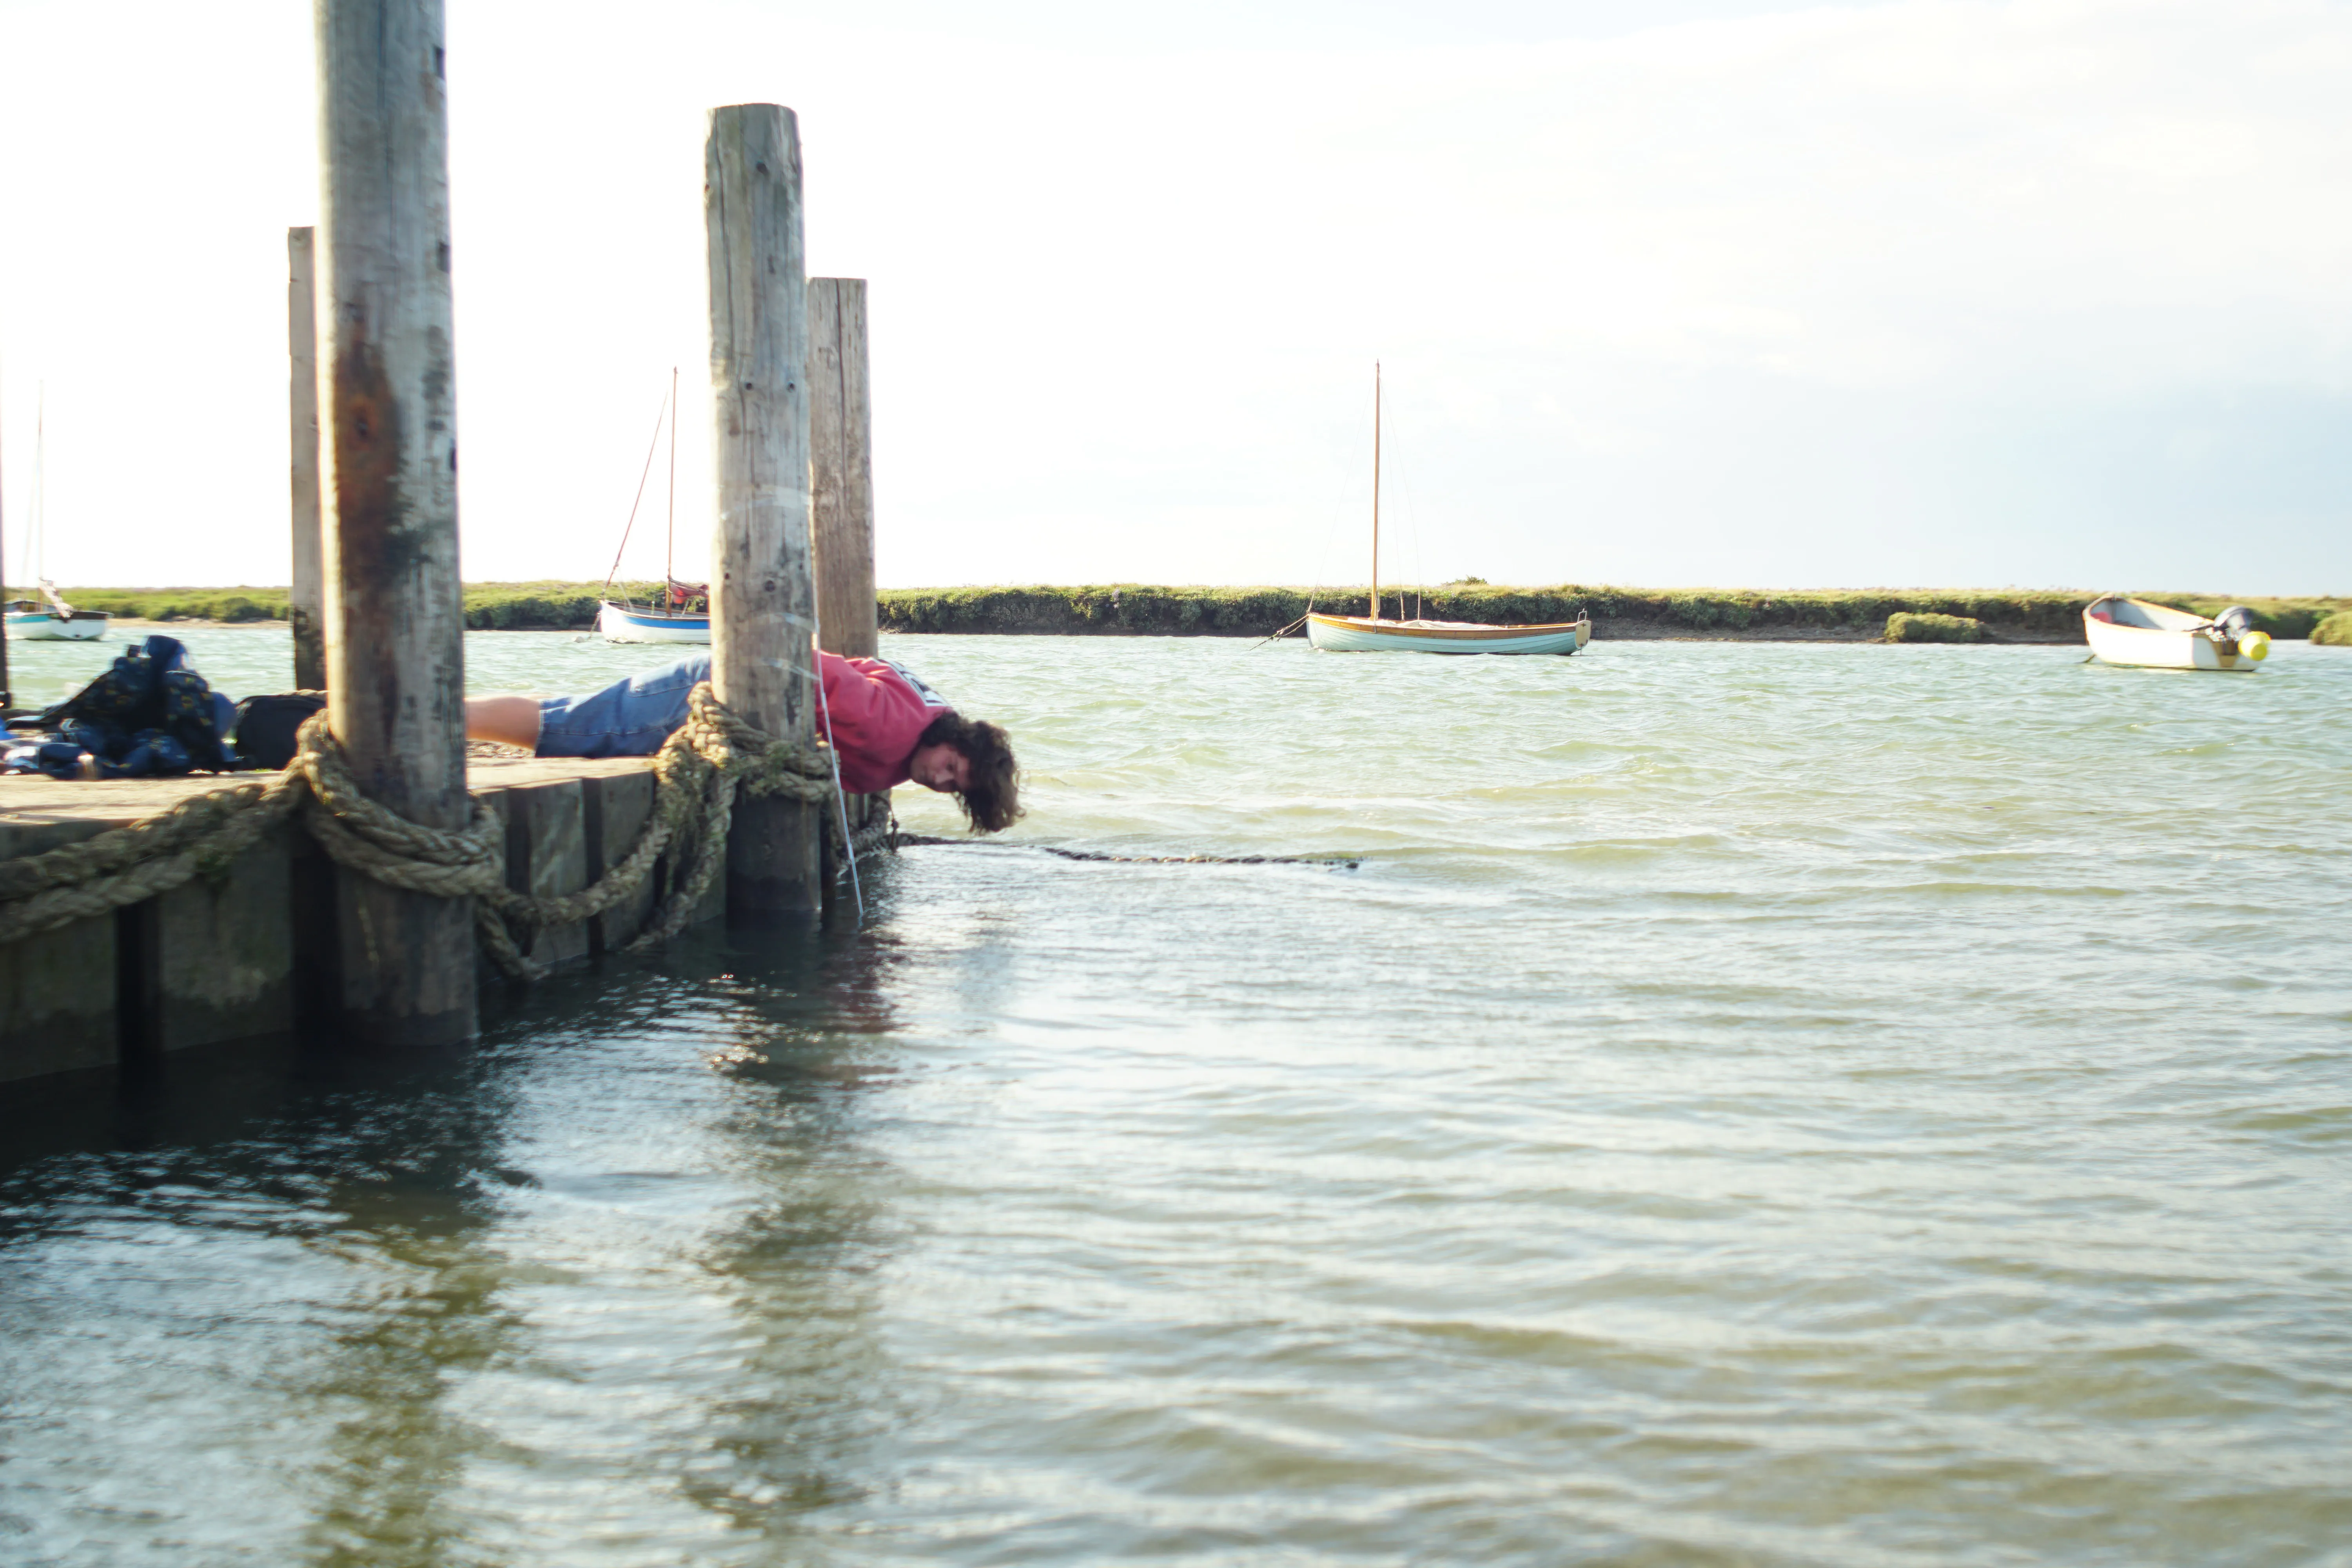
Which leaves the method in the photograph at the top of this page: go there at the right state of tide, set a marked staff against something that does not move, and read the waterline every five minutes through the turn. It is slow, it is weather-dependent, and it is the only measurement of these places that exists.
We write down what we expect to see before going out, and date it. Recording a prediction only after seeing the result is rationalising, not testing.
The first one: Burnham Overy Staithe, 26 July 2026
We had published a window of 17:24–18:24 for that afternoon’s high water, centred on 17:54. The water peaked at 17:58 — four minutes later than we said, and comfortably inside the window with 26 minutes to spare.
The 33 readings
| Time (BST) | Height on the stick |
|---|---|
| 16:55 | 50 cm |
| 17:00 | 53 cm |
| 17:05 | 56 cm |
| 17:10 | 59 cm |
| 17:15 | 61 cm |
| 17:20 | 62 cm |
| 17:25 | 64 cm |
| 17:30 | 65 cm |
| 17:35 | 66 cm |
| 17:40 | 66 cm |
| 17:45 | 66 cm |
| 17:50 | 66 cm |
| 17:55 | 66.5 cm |
| 18:00 | 66.5 cm |
| 18:05 | 65 cm |
| 18:10 | 63.5 cm |
| 18:15 | 62 cm |
| 18:20 | 60 cm |
| 18:25 | 58.5 cm |
| 18:30 | 57 cm |
| 18:35 | 54 cm |
| 18:40 | 52 cm |
| 18:45 | 48.5 cm |
| 19:00 | 41 cm |
| 19:05 | 36.5 cm |
| 19:10 | 33.5 cm |
| 19:15 | 30 cm |
| 19:20 | 27 cm |
| 19:25 | 22 cm |
| 19:30 | 18 cm |
| 19:35 | 14.5 cm |
| 19:40 | 10.5 cm |
| 19:45 | 5.5 cm |
That is a better result than we expected. Our written-down prediction was that the water would peak early, by 10 to 25 minutes, because that is the pattern the Wells gauge shows. It did not. Which makes the gauge finding more interesting rather than less: whatever is running late at Wells may be a feature of that harbour, or of the gauge in it, rather than something wrong with the underlying model everywhere.
We also expected the turn to be flat, and it was — the water sat within two centimetres of its peak for 35 minutes, and within five centimetres for very nearly an hour. That is worth knowing on its own. At the top of the tide in a creek like this, “high water” is a period, not an instant.
This has not changed the published offset for Burnham Overy Staithe, and it has not moved it out of the “not independently checked” class. One tide is one tide: it was a neap, which is the weakest case for this kind of test, and wind and pressure move real water by more than four minutes. What it does establish is that the number we publish there is not badly wrong.
What would fix this properly
One person with a staff and a watch cannot produce the continuous record these locations need — you would have to stand there for months. So we are designing a low-cost tide gauge: something cheap enough to leave at a creek for a season, and simple enough that losing one to a winter storm is an inconvenience rather than a disaster.
When it has been built and tested against a location we can already check, we will open-source the design — parts, build notes and firmware — so that anyone wanting real numbers for their own creek can have them. There is no point us being the only people who can measure this coast. We will publish it when it works, not before.
What this is not
Everything here is a prediction of the astronomical tide — the part driven by the moon and the sun, which is knowable years ahead. It cannot know what the weather is doing, and wind, pressure and surge all move real water, sometimes by more than the windows on this site.
It is one input to a decision you make — never the decision itself. Do not use this site for navigation or for any safety-critical decision.
Current tables generated 23 October 2026 · TICON-4 harmonic constants via @neaps/tide-database (CC-BY-4.0, Hart-Davis et al., 2025)